
 Globex stock analysis published yesterday


BUY
REC reflects the cumulative effect of all the VectorVest parameters working together. These parameters are designed to help investors buy safe, undervalued stocks rising in price.

Current Price: $1.43
Current Value: $2.20
GMX has a current Value of $2.20 per share; compared to a Price of $1.43 per share, this stock is currently undervalued. Value is computed from forecasted earnings per share, forecasted earnings growth, profitability, interest, and inflation rates.


EXCELLENT
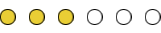
RV is an indicator of long-term price appreciation potential. GMX has an RV of 1.62, which is excellent on a scale of 0.00 to 2.00. This indicator is far superior to a simple comparison of Price and Value because it is computed from an analysis of projected price appreciation three years out, AAA Corporate Bond Rates, and risk.

FAIR
RS is an indicator of risk. GMX has an RS of 0.99, which is fair on a scale of 0.00 to 2.00. RS is computed from an analysis of the consistency and predictability of a company’s financial performance, debt to equity ratio, sales volume, business longevity, price volatility and other factors.

EXCELLENT
RT analyzes a stock’s price trend. GMX has a Relative Timing of 1.86, which is excellent on a scale of 0.00 to 2.00. RT is computed from an analysis of the direction, magnitude, and dynamics of a stock’s price movements day-over-day, week-over-week, quarter-over-quarter and year-over-year. If a trend dissipates, RT will gravitate toward 1.00.

EXCELLENT
VST is the master indicator for ranking every stock in the VectorVest database. GMX has a VST rating of 1.55, which is excellent on a scale of 0.00 to 2.00. VST is computed from the square root of a weighted sum of the squares of RV, RS, and RT. Stocks with the highest VST ratings have the best combinations of Value, Safety and Timing.

Stop Price: $1.17
Stop is an indicator of when to sell a position. GMX has a Stop of $1.17 per share. A stock’s Stop is computed from a 13 week moving average of its closing prices, and is fine-tuned according to the stock’s fundamentals.

EXCELLENT
CI is an indicator which reflects a stock’s ability to resist severe and/or lengthy price declines. GMX has a CI of 1.70, which is excellent on a scale of 0.00 to 2.00. CI is based solely upon a stock’s long-term price history.
GRT (Earnings Growth Rate): GRT reflects a company’s one to three year forecasted earnings growth rate in percent per year. GMX has a forecasted Earnings Growth Rate of 38.00 %, which VectorVest considers to be excellent.
EPS (Earnings per Share): EPS stands for leading 12 months Earnings Per Share. GMX has a forecasted EPS of $0.16 per share. VectorVest determines this forecast from a combination of recent earnings performance and traditional fiscal and/or calendar year earnings forecasts.
P/E (Price to Earnings Ratio): P/E shows the dollars required to buy one dollar of earnings. GMX has a P/E of 8.94. The average P/E of all the stocks in the VectorVest database is 86.88.
EY (Earnings Yield): EY reflects earnings per share as a percent of Price. GMX has an EY of 11.19 %. This is above the current average of 1.15 % for all the stocks in the VectorVest database.
GPE (Growth to P/E Ratio): GMX has a GPE rating of 4.25. A stock is commonly considered to be undervalued when GPE is greater than 1.00.
DIV (Dividend): VectorVest reports annual, regular, cash dividends as indicated by the most recent payments. Special distributions, one-time payments, stock dividends, etc., are not generally included in DIV. GMX does not pay a dividend.
DY (Dividend Yield): DY reflects dividend per share as a percent of Price. GMX does not pay a dividend, so it does not have a Dividend Yield rating. DY equals 100 x (DIV/Price). It is useful to compare DY with EY. If DY is not significantly lower than EY, the dividend payment may be in jeopardy.
DS (Dividend Safety): DS is an indicator of the assurance that regular cash dividends will be declared and paid at current or at higher rates for the foreseeable future. GMX does not pay a dividend, so it does not have a Dividend Safety rating. Stocks with DS values above 75 typically have RS values well above 1.00 and EY levels that are much higher than DY.
DG (Dividend Growth Rate): Dividend Growth is a forecasted annual growth rate of a company’s dividend based on historical dividend payments and dividend predictability. It is a subtle yet important indicator of a company’s financial performance. It also provides some insight into the board’s outlook on the company’s ability to increase earnings. GMX does not pay a dividend, so it does not have a Dividend Growth rating.
YSG (YSG-Vector): YSG is an indicator which combines DY, DS and DG into a single value, and allows direct comparison of all dividend-paying stocks in the database. GMX does not pay a dividend, so it does not have a YSG rating. Stocks with the highest YSG values have the best combinations of Dividend Yield, Safety and Growth. These are the stocks to buy for somewhat above current income and long-term growth.
AvgVol: AvgVol is the 50 day moving average of daily volume as computed by VectorVest. GMX has an AvgVol of 102,600 shares traded per day.
%Vol: %Vol reflects the percent change in today’s trading volume as compared to the AvgVol. %Vol equals ((Volume – AvgVol) / AvgVol ) * 100. GMX had a %Vol of 85.12 % on Wednesday, June 16, 2021
%PRC: GMX Price changed 2.88 % from the prior day’s closing price.
Sales: GMX has annual sales of 8,000,000
Sales Growth: Sales Growth is the Sales Growth Rate in percent over the last 12 months. GMX has a Sales Growth of 436.00 % per year. This is excellent.
Sales Per Share (SPS): GMX has annual sales of $0.15 per share.
Price to Sales Ratio (P/S): GMX has a P/S of 9.77.
Shares: GMX has 55,000,000 shares of stock outstanding.
Market Capitalization: GMX has a Market Capitalization of 78,000,000.
Business Sector: GMX has been assigned to the Mining Business Sector. VectorVest classifies stocks into over 200 Industry Groups and 40 Business Sectors.
Industry Group: GMX has been assigned to the Mining (Gold\Silver) Industry Group. VectorVest classifies stocks into over 200 Industry Groups and 40 Business Sectors.
DISCLAIMER: VectorVest is licensed by VectorVest, Inc., and is protected by United States copyright laws and international treaty provisions. The information contained herein is for your exclusive, personal use only. You may print a single copy of any stock analysis for your exclusive use, but it is not to be reproduced for distribution without the expressed written consent of VectorVest, Inc. You should be aware of the risks involved in stock investing, and you use the material contained herein at your own risk. This material is believed to be reliable, but neither VectorVest, Inc., nor any of its suppliers guarantee its accuracy or validity, nor are they responsible for any errors or omissions which may have occurred. The analysis, ratings, and/or recommendations made by VectorVest, and/or any of its suppliers do not provide, imply, or otherwise constitute a guarantee of performance.
VectorVest is comprised of reports embodying a unique system of stock analysis. All contents and recommendations are based on data and sources believed to be reliable, but accuracy and completeness cannot be guaranteed. Users should be aware of the risks involved in stock investments. It should not be assumed that future results will be profitable or will equal past performance, real, indicated or implied. VectorVest and/or its principals may purchase or sell any of the securities cited herein. VectorVest and the logostyle, geometric design are, individually and collectively, service marks owned by VectorVest, Inc. VectorVest is published daily by VectorVest, Inc. 20472 Chartwell Center Drive Cornelius, NC 28031 +1 704-895-4095
https://www.globexmining.com/index.php
Related Posts
Tags
Share This


